The Graph of Romanian Businessmen
Extraction, analysis, and visualisation of Romania’s business-ownership network — from 6.8 GB of Official Gazette PDFs to a searchable graph of ~370,000 people and the companies that link them.
The brief
The Romanian Official Gazette, part 4, publishes every company establishment declaration in the country — founders, administrators, registered addresses, share distribution, CAEN activity code. Eleven years of it (2001–2011 and 2014), 48,240 PDFs, about 6.8 GB of unstructured text, some of it pre-UTF-8, none of it machine-readable.
The goal: turn it into a graph — people linked through the companies they co-founded, and companies linked through shared founders — and make that graph searchable. A journalist or economist types a name, gets the connected component of that person’s business network, plus centrality metrics for who matters inside it.
Pipeline
1. Information extraction — Python + Apache PDFBox
PDFBox (Java) converted the gazettes to text. A Python script classified each paragraph as company-establishment or not, then regex-extracted structured fields into MongoDB. The classifier was hand-verified across 7 randomly sampled gazettes — 98% correct.
The hardest part was character encoding: pre-2007 PDFs used non-UTF-8 Romanian glyph mappings that had to be reverse-mapped to UTF-8 by hand, glyph by glyph. Apache Solr sat alongside the pipeline as a fast full-text index for debugging and iterating on regex patterns.
2. Graph construction — Java
Two graphs built in parallel from the same MongoDB source. The person graph: nodes are people, an edge exists between two people if they co-founded the same company. The company graph: nodes are companies, an edge exists if they share a founder or administrator. Both hash-map backed for O(1) insert and lookup.
A name-extraction pass handled founders and administrators. Romanian names appear capitalised, all-caps, or last-name-capitalised, occasionally with a father initial. False positives like EURO RON ROL had to be explicitly filtered.
3. Analysis — Gephi and custom Java
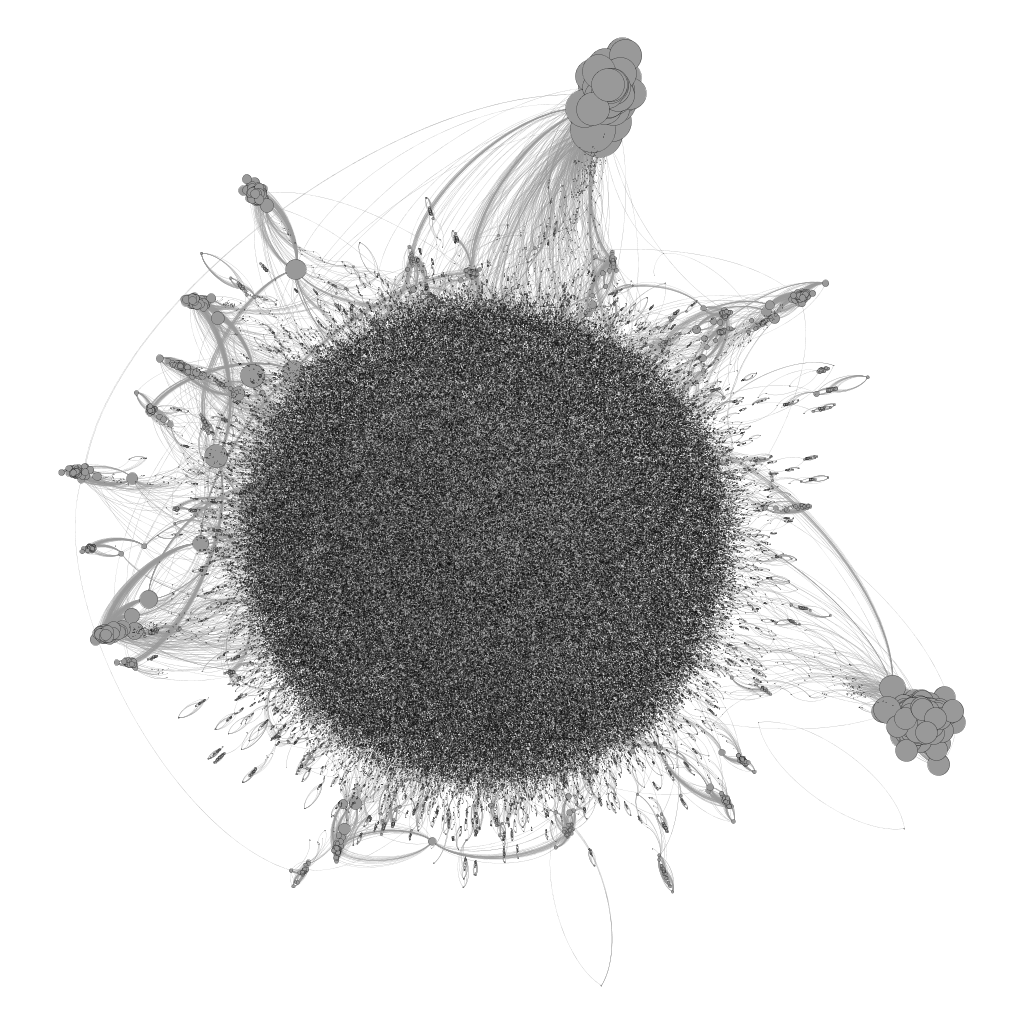
Gephi for visual layout (force-atlas) and macro-level metrics. Custom implementations of Floyd–Warshall (all-pairs shortest paths) and Dijkstra backed the per-query metrics served by the web service — average shortest path, diameter, and betweenness centrality of any queried node.
4. Storage — Neo4j
The full person graph didn’t fit in RAM. Moving it to Neo4j solved the memory problem and made per-component queries fast. Each connected component was labelled on insert, so Cypher could isolate a component by label rather than traversing from an arbitrary seed node. Switching from single-transaction inserts to Neo4j’s batch insert mode dropped write time by roughly 100×.
5. Delivery — Java Servlets, PHP proxy, SigmaJS
A Java Servlet on Tomcat exposed an HTTP GET API. The JSON response carried the connected component plus metrics — node count, edge count, diameter, average path length, the betweenness and rank of the matched node, and the most influential node in the component. A PHP proxy forwarded the browser’s AJAX requests to sidestep same-origin restrictions. SigmaJS rendered the graph in a browser canvas with force-atlas layout.
Key numbers
What made it interesting
- Disambiguation without PII. The gazette doesn’t publish personal identifiers, so two people with the same name collapsed into one node. City-of-registration as a disambiguator was considered and dropped — one founder can register companies in multiple cities, so the fix would have invented false separations.
- Pre-UTF-8 encodings. Older PDFs used bespoke glyph mappings for Romanian diacritics. Automated replacement got about 80% of the way. The rest was a hand-curated substitution table.
- Scale versus memory. The person graph didn’t fit in RAM. The fix was Neo4j with batched inserts and forced garbage collection after each component was persisted.
- A bug I never fixed. Regex-matched property queries inside Cypher silently returned nothing against UTF-8 values. Filed upstream, never resolved during the project. Search by city, year, and CAEN code in the final app doesn’t work because of it — and the case study is more honest for saying so.
What the graph said
- The Romanian business graph is sparse. Comparable social graphs put 99%+ of nodes in the giant component; this graph puts 17%. Most companies in the sample are small, often single-founder ventures with little cross-collaboration — a snapshot of an economy on the rise rather than a consolidated one.
- Degree is a bad centrality metric here. Sorted by degree, the top “business persons” are the county and city councils of Cluj-Napoca, Constanta, Sibiu. They front public contracts and end up as parties on lots of paperwork. Eigenvector centrality surfaced actual individuals with meaningful corporate reach.
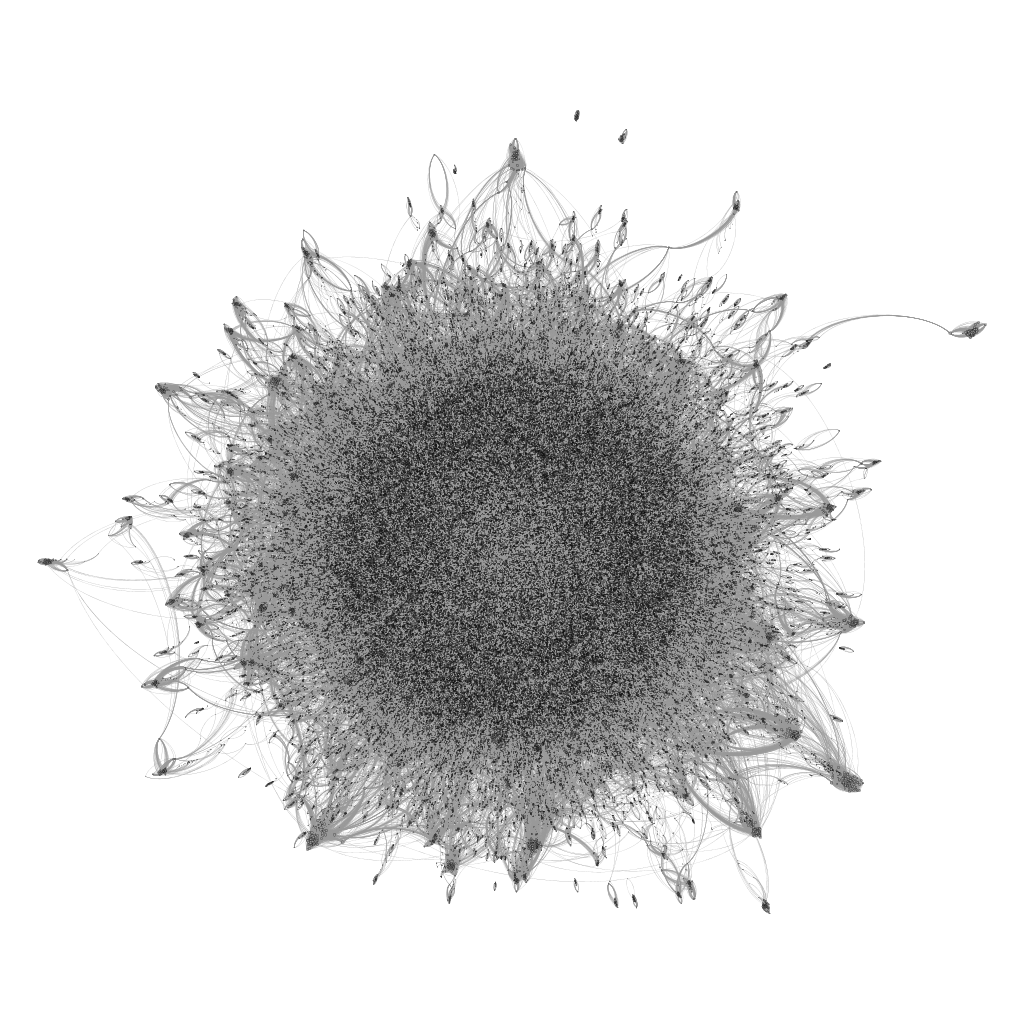
- Companies are ~2.5× more connected than people. A company can link to many others through any of its founders; a person only links through co-founding. Average degree 6.72 vs 2.65. Clustering coefficient 0.854 vs 0.707.
Looking back
Twelve years on, most of the core picks still look right: Python for text wrangling, MongoDB for flat records, Neo4j for the graph itself, a thin service layer between the database and the browser. What dates: Java Servlets as a choice (now a heavy pick for what this does), SigmaJS (newer renderers are cleaner), and the PHP proxy. The actual hard problem — structured extraction from poorly-OCR’d legal PDFs in a non-English language — is still hard, and is arguably LLM-shaped today.
The interactive demo lived at ionelmerca.com — the same domain this portfolio now occupies. Between then and now the page sat blank.